A Deep Dive into G20 Economies: Regional and Comparative Analysis
The G20 economies collectively represent approximately 85% of global GDP, 75% of international trade, and 60% of the world’s population. This article delves deeper into the regional characteristics, comparative insights, and actionable strategies for these economies, focusing on their unique challenges, opportunities, and the future of global economic growth.
—
1. Asia: The Growth Powerhouse
China: Dominance vs. Dependency
Data Insights:
2023 GDP (PPP): $33.1 trillion (24% of global GDP).
Exports: $3.59 trillion (2023), leading in electronics, machinery, and textiles.
Debt-to-GDP Ratio: 282% (2023).
R&D Spending: $470 billion (second globally, after the US).
Challenges:
1. Heavy reliance on exports and infrastructure-driven growth.
2. Shrinking workforce due to aging population (median age: 38.4 years).
3. Tensions in global trade, especially with the US.
Actionable Strategies:
1. Diversification: Transition from manufacturing to services and high-tech industries.
2. Sustainability: Increased investment in renewable energy (already a leader in solar and wind power).
3. Global Collaboration: Strengthen partnerships through Belt and Road Initiative (BRI) while addressing debt trap concerns.
—
India: The Rising Star
Data Insights:
2023 GDP (PPP): $16 trillion (12% of global GDP).
Exports: $770 billion (2023), with IT services and pharmaceuticals leading.
Demographics: Over 50% of the population under 30 years.
Challenges:
1. Infrastructure gaps, especially in transportation and energy.
2. Overdependence on agriculture (15% of GDP but employs 45% of the workforce).
3. Socio-economic disparities between urban and rural areas.
Actionable Strategies:
1. Infrastructure Modernization: Invest in urban transport, smart cities, and renewable energy.
2. Skill Development: Upskill the workforce for high-tech industries (AI, robotics).
3. Trade Expansion: Strengthen ties with Africa, ASEAN, and Europe for exports.
—
Japan: Aging Economy with Technological Leadership
Data Insights:
2023 GDP (PPP): $6.6 trillion.
Exports: $813 billion, with a focus on electronics, cars, and machinery.
Aging Population: Over 28% of the population is above 65 years.
Challenges:
1. Declining birth rate and labor shortages.
2. High public debt (over 260% of GDP).
Actionable Strategies:
1. Automation: Leverage robotics to offset labor shortages.
2. Immigration Reform: Open borders to skilled foreign workers.
3. Green Growth: Expand investments in hydrogen energy and EVs.
—
Indonesia & South Korea: The Emerging Middle Players
Data Insights:
Indonesia’s GDP (PPP): $4.7 trillion; focused on commodities like coal, palm oil, and rubber.
South Korea’s GDP (PPP): $3.3 trillion; globally recognized for tech giants like Samsung and Hyundai.
Actionable Strategies for Indonesia:
1. Industrial Diversification: Move beyond commodity exports into value-added manufacturing.
2. Tourism Growth: Capitalize on natural resources (e.g., Bali).
Actionable Strategies for South Korea:
1. Innovation Ecosystem: Increase funding for startups and R&D.
2. Geopolitical Stability: Strengthen ties with ASEAN nations for economic resilience.
—
2. North America: Innovation Meets Integration
United States: Innovation and Leadership
Data Insights:
2023 GDP (Nominal): $26.9 trillion (largest globally).
Exports: $1.8 trillion, with technology, agriculture, and energy leading.
Defense Spending: $801 billion annually (39% of the global total).
Challenges:
1. Rising national debt ($32 trillion, 2023).
2. Growing wealth inequality (top 1% own 33% of the wealth).
Actionable Strategies:
1. Manufacturing Revival: Boost domestic production via “reshoring” initiatives.
2. Climate Leadership: Strengthen renewable energy policies and EV adoption.
3. Digital Inclusion: Invest in nationwide broadband and skill development.
—
Canada and Mexico: The USMCA Connection
Data Insights:
Canada’s GDP: $2.6 trillion (PPP).
Mexico’s GDP: $3.3 trillion (PPP).
Trade: Over 75% of Canada and Mexico’s exports go to the US.
Actionable Strategies:
1. Canada: Focus on clean energy exports and diversify trade (e.g., with Europe and Asia).
2. Mexico: Expand maquiladora industries and foster domestic manufacturing.
—
3. Europe: Advanced Economies with Structural Challenges
Germany: The Manufacturing Titan
Data Insights:
Exports: $1.6 trillion, with cars, machinery, and chemicals leading.
Dependency on China: Nearly 9% of exports go to China.
Actionable Strategies:
1. Energy Independence: Accelerate the shift to renewables post-Russia-Ukraine conflict.
2. AI and Industry 4.0: Innovate in advanced manufacturing techniques.
—
France and Italy: Service Economies
France relies on luxury goods (LVMH dominates globally) and tourism (89 million annual visitors pre-pandemic).
Italy excels in fashion, design, and tourism but lags in digital transformation.
Actionable Strategies:
1. France: Support startups and digital entrepreneurs to reduce unemployment.
2. Italy: Modernize public systems (transport, healthcare) and promote sustainable tourism.
—
4. BRICS: Challenging the Western Order
China and India’s Leadership: Already covered under Asia.
Russia and Brazil: Resource Dependency
Russia earns over 50% of its revenues from energy exports.
Brazil is the top producer of soybeans and beef.
Actionable Strategies:
1. Russia: Diversify exports beyond oil and gas; focus on IT and tech outsourcing.
2. Brazil: Tackle deforestation and improve agricultural productivity through green technologies.
—
Comparative Insights Expanded
1. G7 vs. BRICS: Diverging Paths
BRICS Growth: Growing at an average of 4.2% annually, compared to G7’s 1.6%.
Debt Levels: G7 faces higher public debt burdens, while BRICS economies focus on infrastructure spending.
2. Climate Action Disparities
Europe: Leads global climate policy (e.g., Germany’s renewable energy initiatives).
Asia: Faces the largest carbon footprint but invests heavily in green energy.
—
Future Outlook
1. Emerging Markets: By 2050, BRICS economies could surpass the G7 in economic output, driven by India and China.
2. Technological Disruption: The US and Asia (South Korea, Japan) will dominate AI, biotechnology, and space exploration.
3. Sustainability Challenges: Climate resilience will shape global trade and development. Economies failing to adapt will face significant setbacks.
By fostering regional cooperation, investing in human capital, and adopting sustainable practices, the G20 economies can lead the world toward a more equitable and prosperous future.
This is a visualization comparing the GDP (PPP) and Debt-to-GDP ratios of key G20 economies.
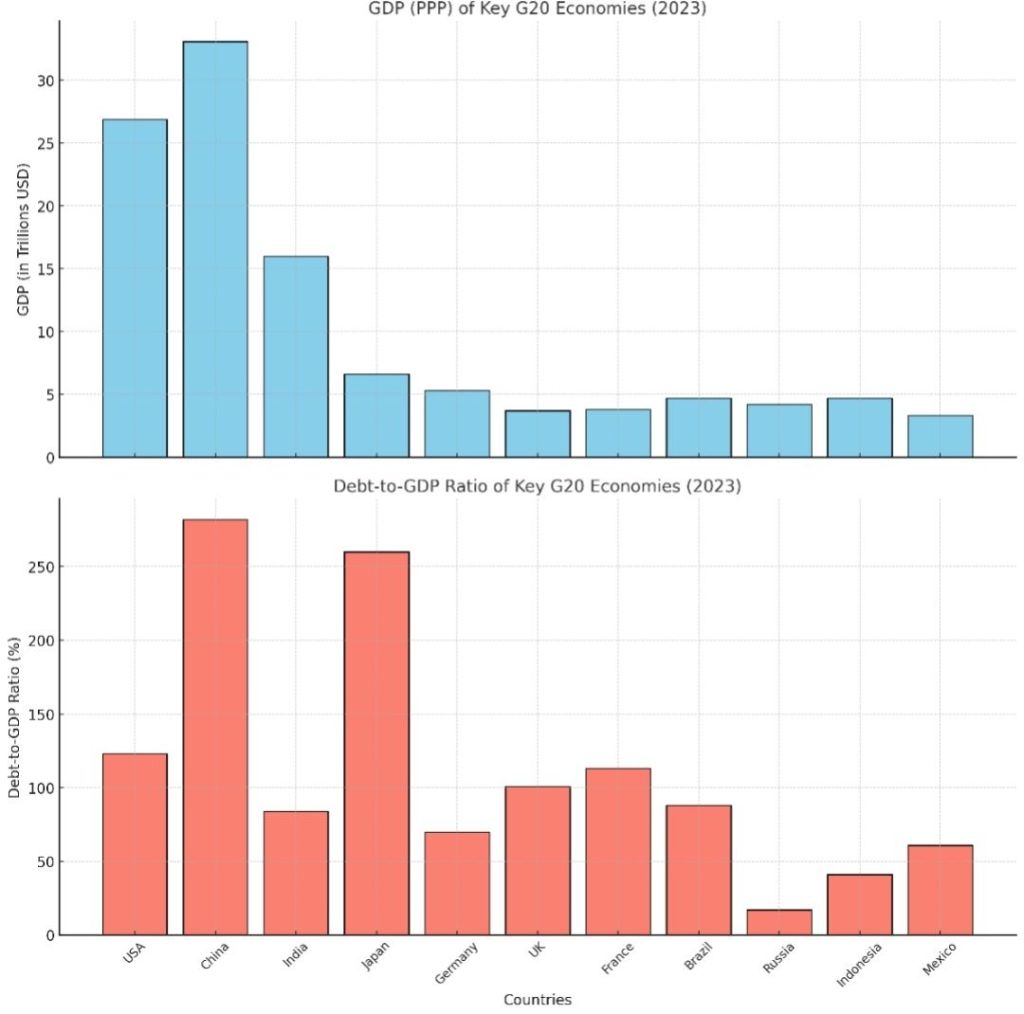
Here’s a summary of insights:
GDP (PPP) Highlights:
1. China leads with $33.1 trillion, contributing significantly to the global economy.
2. The USA follows at $26.9 trillion, underscoring its position as a major economic powerhouse.
3. India ranks third with $16 trillion, reflecting rapid economic growth and its role in BRICS.
Debt-to-GDP Ratio Highlights:
1. Japan has the highest Debt-to-GDP ratio (260%), highlighting fiscal challenges despite its strong economy.
2. China also has a high ratio (282%), driven by infrastructure investments and government policies.
3. India (84%) and Indonesia (41%) demonstrate relatively lower debt burdens, offering fiscal flexibility.
Actionable Insights and Strategies:
1. China: Focus on diversifying investments and reducing debt reliance while enhancing productivity.
2. USA: Manage federal debt through reforms, invest in advanced technologies, and strengthen trade ties.
3. India: Leverage its demographic dividend to boost innovation, manufacturing, and exports.
4. Developing Economies (Brazil, Indonesia): Improve infrastructure and prioritize sustainability for long-term growth.
#G20Economies #GlobalGDP #EconomicInsights #DebtToGDP #ChinaEconomy #IndiaGrowth #USAEconomy #BRICSEconomies #FiscalPolicy #EconomicFuture


Leave a reply to PebbleGalaxy Cancel reply